
JANUARY 14, 2018
Home prices trended down in the second half of 2018
The Teranet–National Bank National Composite House Price IndexTM for December was down 0.3% from the previous month. It was the third consecutive monthly retreat. The component indexes were down for seven of the 11 metropolitan markets surveyed: Edmonton (−1.4%), Vancouver (−1.2%), Winnipeg (−0.9%), Calgary (−0.6%), Victoria (−0.4%), Hamilton (−0.4%) and Quebec City (−0.4%). Indexes were up for Ottawa-Gatineau (1.0%), Montreal (0.4%), Toronto (0.2%) and Halifax (0.1%).
The recent trend of home prices is clearly downward in most metropolitan markets. For Calgary December was a sixth straight month without an index rise, a cumulative decline of 2.0%; for Vancouver a fifth straight month and a cumulative loss of 2.9%; for Edmonton a fourth straight month and a cumulative loss of 2.7%. For Victoria, Winnipeg and Hamilton it was a third straight month, with cumulative losses of 0.5%, 1.6% and 1.0% respectively. The Halifax index was down 1.6% from five months ago, Quebec City and Toronto were down −0.8% and −0.2% respectively from four months ago. Only the Ottawa-Gatineau and Montreal indexes finished 2018 in strength, rising 7.9% and 4.8% respectively from March to December and both ending the year at all-time highs.
Teranet-National Bank National Composite House Price Index™
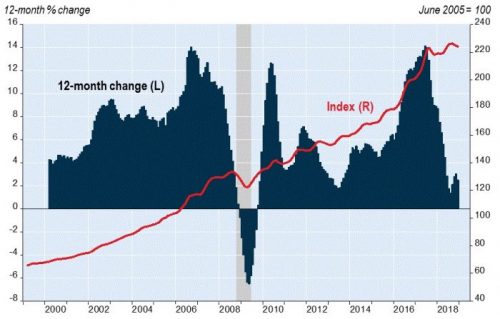
The weakness of most of the country’s large urban markets in the second half of the year meant, as table below shows, that the index was down of flat for five markets for calendar 2018: Calgary (−2.6%), Edmonton (−0.9%), Winnipeg (−0.5%), Quebec City (−0.1%) and Halifax (flat). For a calendar year, it was the narrowest diffusion of 12-month gains since the recession year of 2008. Up from a year earlier despite second-half retreats were Victoria (6.0%), Hamilton (4.4%), Toronto (3.7%) and Vancouver (1.4%). As expected, Ottawa-Gatineau (5.9%) and Montreal (4.4%) were among the leaders. The 12-month advance of the composite index, at 2.5%, was the smallest since 2009.
Besides the Toronto and Hamilton indexes included in the composite index, indexes exist for seven other urban areas of the Golden Horseshoe. From August to December, indexes were down for Brantford (−4.0%), Oshawa (−2.1%), Barrie (−2.1%), Guelph (−1.1%) and Kitchener (−0.3%). From September to December, the Peterborough index fell 5.1%. Only the St. Catharines index with its 12-month gain of 8.6% ended the year at a record.
Indexes not included in the composite index also exist for seven markets outside the Golden Horseshoe, five of them in Ontario and two in B.C. From August to December, indexes were down for Thunder Bay (−5.3%), Abbotsford-Mission (−1.7%) and Sudbury (−1.2%), and from September to December the index for Kelowna was down 2.0%. Three of these indexes did not display weakness in 2018, finishing the year with strong 12-month gains: Windsor (14.7%), London (10.7%) and Kingston (9.9%).
For the full report including historical data, please visit www.housepriceindex.ca.